StackTrace
StackTrace is a module you can use to inspect what an application is doing
internally while it runs. It provides an interface for monitoring method
calls, which you can use to build monitoring and debugging tools.
// In the browser
JS.require('JS.StackTrace', function(StackTrace) { ... });

// In CommonJS
var StackTrace = require('jsclass/src/stack_trace').StackTrace;
The StackTrace module supports the Observable interface
for monitoring what the stack is doing:
StackTrace.addObserver(monitor);
monitor should be an object that responds to the update() method. This
method takes two arguments: an event name, and an event object. So, the object
should look something like this:
monitor = {
    update: function(event, data) {
        if (event === 'call') // ...
    }
};
There are three types of event, which tell you when a function is called, when a function returns, and when an error is thrown.
call event
The call event fires when a function is called. The data object in this
case represents the data surrounding the method call. It has the following
properties:
object– The object receiving the method callmethod– TheMethodobject for the current method callenv– TheClassorModulewhere the method is being executedargs– AnArrayof the arguments to the method callleaf– Boolean indicating whether the call is a leaf; it’s a leaf if no other method calls are logged while it is running. This is alwaystruewhen a method is first called.
return event
The return event fires when a function returns. The data object is the
same object that’s passed to the call event, with one extra property:
result– The return value of the method call
error event
This event fires when an exception is thrown. The data object is just the
error that was raised.
Enabling tracing
Since tracing incurs a performance cost, jsclass does not trace anything by
default. When you want to trace a module or class, you pass a list of the
modules you want to trace to Method.trace(), and use Method.untrace() to
stop tracing them.
Method.trace([Hash, Range]);
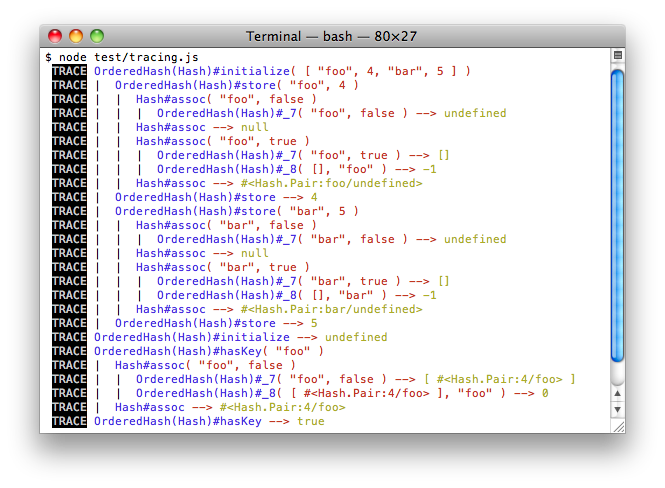
Call stack logging
There is a logger you can use to print the call stack to the
Console. To use it, just pass a list of modules to trace
and a function to Method.tracing(). This enables tracing for the given
modules, runs the function, then disables tracing again.
Method.tracing([Hash], function() {
    var hash = new OrderedHash(['foo', 4, 'bar', 5]);
    hash.hasKey('foo');
});